Page 206 - NHB AR 2020-21-3 complete- Print (1)
P. 206
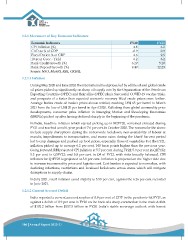
1.2.1 Movement of Key Economic Indicators
Economic Indicators FY20 FY21
CPI Inflation (%) 4.8 6.2
CAD as % of GDP -0.9 0.9
Fiscal Deficit % of GDP 4.6 9.5
10-year G sec - Yield 6.2 6.2
Bank Credit Growth (%) 6.29 5.10
Bank Deposit Growth (%) 9.49
12.29
Source: NSO, MoSPI, RBI, CRISIL
1.2.1.1 Inflation
During May 2020 and June 2020, the international food prices, led by edible oil and global crude
oil prices picked up significantly on sharp oil supply cuts by the Organisation of the Petroleum
Exporting Countries (OPEC) and their allies (OPEC plus). Successful COVID-19 vaccine trials,
and prospects of a faster than expected economic recovery lifted crude prices even further.
Average Indian crude oil basket prices almost trebled, reaching US$ 65 per barrel in March
2021 from the low of US$ 20 per barrel in April 2020. Reflecting these global commodity price
developments, consumer price inflation in Emerging Market and Developing Economies
(EMDEs) picked up after having declined sharply in the beginning of the pandemic.
In India, headline inflation which started picking up in H2FY20, remained elevated during
FY21 and reached a multi-year peak of 7.6 per cent in October 2020. The reasons for the above
include supply disruptions during the nationwide lockdown, non-availability of labour at
mandis, impediments to transportation, and excess rains during the kharif harvest period
led to crop damages and pushed up food prices, especially those of vegetables. For the FY21,
inflation picked up to average 6.2 per cent, 140 basis points higher than the previous year.
Going forward, RBI projected CPI inflation at 5.7 per cent during FY22; 5.9 per cent in Q2FY22;
5.3 per cent in Q3FY22; and 5.8 per cent in Q4 of FY22, with risks broadly balanced. CPI
inflation for Q1FY23 is projected at 5.1 per cent. Inflation is projected on the higher side due
to increase in commodity price and logistics cost. Cost burden is expected to normalize, with
declining infections, restrictions and localized lockdowns across states which will mitigate
disruptions to supply chains.
In July 2021, retail inflation eased slightly to 5.59 per cent, against the 6.26 per cent recorded
in June 2021.
1.2.1.2 Current Account Deficit
India reported a current account surplus of 0.9 per cent of GDP in the pandemic-hit FY21, as
against a deficit of 0.9 per cent in FY20 on the back of a sharp contraction in the trade deficit
of $102.2 billion from $157.5 billion in FY20. India’s stable sovereign outlook with lowest
186 | Annual Report 2020-21