Page 219 - NHB AR 2020-21-3 complete- Print (1)
P. 219
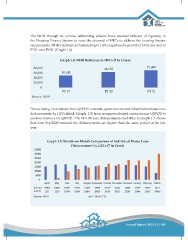
The NHB through its various refinancing scheme have ensured infusion of liquidity in
the Housing Finance System to cater the demand of HFCs to address the housing finance
requirements. NHB’s Refinance Outstanding to HFCs registered a growth of 10.41 per cent in
FY21 over FY20. (Graph: 1.6)
Graph 1.4: NHB Refinance to HFCs (` in Crore)
Due to easing of lockdown from Q2FY21 onwards, quick turnaround in individual home loan
disbursements by HFCs lifted, (Graph: 1.5) from an unprecedented contraction in Q1FY21 to
positive territory by Q3FY21. The M-o-M loan disbursements by HFCs in Graph 1.7 shows
that from Sep’2020 onwards the disbursements are higher than the same period of the last
year.
Graph 1.5: Month-on-Month Comparison of Individual Home Loan
Disbursement by HFCs (` in Crore)
Annual Report 2020-21 | 199